Curve Sketching
This page covers Curve Sketching within Coordinate Geometry.
Given a particular equation, you need be able to draw a quick sketch of its curve showing the main details (such as where the curve crosses the axes). You should be able to quickly sketch straight-line graphs, from your knowledge that in the equation y = mx + c, m is the gradient and c where the graph crosses the y-axis.
When asked to sketch a more complicated curve, there are a number of things that you should work out before drawing your sketch:
- Asymptotes- these are lines for which the graph is undefined (this means that the curve does not cross asymptotes). Remember that you cannot divide by zero. Therefore, in the graph of 1/(1 + x), x = -1 is an asymptote because when x is -1, you end up dividing by zero. A curve often gets very close to an asymptote, without actually crossing it.
- Work out where the graph crosses the axes. The graph will cross the x-axis when y = 0 and the y-axis when x = 0. Substitute in x = 0 and then y = 0 to determine the crossing points, and mark these on your sketch.
- What happens as x becomes very large? Think about whether y will become very large, very small, positive or negative. What happens as x becomes very small (large and negative)?
- Is the graph symmetrical about the x or y-axes? Remember that the graph is symmetrical about the y-axis if replacing x by -x in the equation of the graph doesn't change the equation (for example y = x2 is symmetrical about the y-axis because if x is replaced by -x, the value of y is not changed since (-x)2 = x2). Functions which are symmetrical in the y-axis are known as even functions.
- The graph is symmetrical about the x-axis if replacing y by -y does not change the equation of the graph. For example y2 = x.
- The graph will have rotational symmetry if f(x) = -f(-x), in other words if replacing x by -x in the equation only results in the sign of the equation being changed. Such functions are known as odd functions.
- You may also think about where the maxima and minima occur (by differentiating). These can then be marked onto your sketch.
Example
Sketch the graph of y = 1 + x
1 - x
1) Asymptotes: When x = 1, we end up dividing by zero so there will be an asymptote at x = 1.
Also think about what happens when y = -1.
-1 = 1 + x
1 - x
-1(1 - x) = 1 + x
-1 + x = 1 + x
-1 = 1.
This cannot happen, since -1 ¹ 1, so the graph cannot be defined for y = -1. This is therefore another asymptote.
2) Where the axes are crossed: When x = 0, y = 1. Therefore the curve crosses the y-axis at (0,1).
When y = 0, 1 + x = 0 so x = -1. Therefore the curve crosses the x-axis at (-1, 0).
3) As x becomes large, 1 + x will become large and positive and 1 - x will become large and negative. Therefore as x becomes large, y = large/-large = -1. As x becomes very large and negative, 1 + x will become very large and negative and 1 - x will become very large and positive. Therefore y = -large/large = -1.
4) By substituting in -x for x it can be seen that the graph is not symmetrical in the x axis.
The sketch of the graph would therefore look something like this:
Image
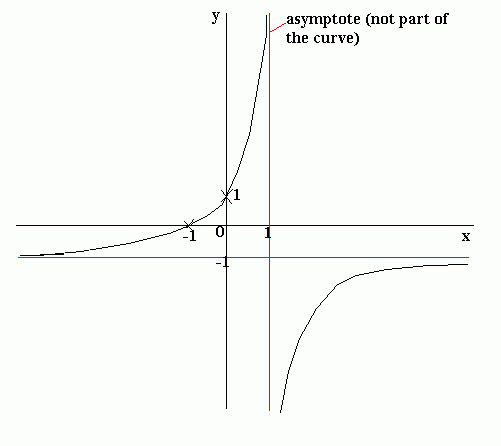
Note that the curve does not cut the lines that we have found to be asymptotes, but it gets extremely close to them.