Skewness
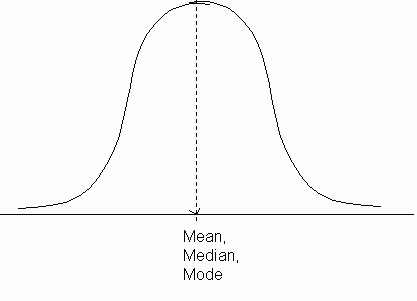
A normal distribution is a bell-shaped distribution of data where the mean, median and mode all coincide. A frequency curve showing a normal distribution would look like this:

In a normal distribution, approximately 68% of the values lie within one standard deviation of the mean and approximately 95% of the data lies within two standard deviations of the mean.
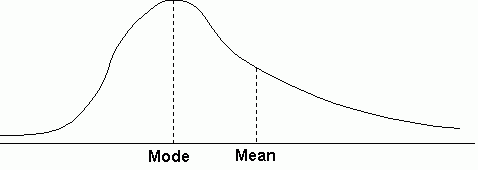
If there are extreme values towards the positive end of a distribution, the distribution is said to be positively skewed. In a positively skewed distribution, the mean is greater than the mode. For example:

A negatively skewed distribution, on the other hand, has a mean which is less than the mode because of the presence of extreme values at the negative end of the distribution.
There are a number of ways of measuring skewness:
| Pearson’s coefficient of skewness | = |
mean – mode |
= | 3(mean – median) |
| Standard deviation | Standard deviation |
| Quartile measure of skewness | = |
Q3 – 2Q2 + Q1 |
|
Q3 – Q1 |
