Cumulative Frequency Graphs
Cumulative Frequency
Cumulative frequency is the running total of the frequencies. On a graph, it can be represented by a cumulative frequency polygon, where straight lines join up the points, or a cumulative frequency curve.
Example
| Frequency: | Cumulative Frequency: | |
| 4 | 4 | |
| 6 | 10 | (4 + 6) |
| 3 | 13 | (4 + 6 + 3) |
| 2 | 15 | (4 + 6 + 3 + 2) |
| 6 | 21 | (4 + 6 + 3 + 2 + 6) |
| 4 | 25 | (4 + 6 + 3 + 2 + 6 + 4) |
This short video shows you how to plotting a cumulative frequency curve from the frequency distribution. How to find the median and inter-quartile range.
The Median Value
The median of a group of numbers is the number in the middle, when the numbers are in order of magnitude. For example, if the set of numbers is 4, 1, 6, 2, 6, 7, 8, the median is 6:
1, 2, 4, 6, 6, 7, 8 (6 is the middle value when the numbers are in order)
If you have n numbers in a group, the median is the (n + 1)/2 th value. For example, there are 7 numbers in the example above, so replace n by 7 and the median is the (7 + 1)/2 th value = 4th value. The 4th value is 6.
When dealing with a cumulative frequency curve, "n" is the cumulative frequency (25 in the above example). Therefore the median would be the 13th value. To find this, on the cumulative frequency curve, find 13 on the y-axis (which should be labelled cumulative frequency). The corresponding 'x' value is an estimation of the median.
Quartiles
If we divide a cumulative frequency curve into quarters, the value at the lower quarter is referred to as the lower quartile, the value at the middle gives the median and the value at the upper quarter is the upper quartile.
A set of numbers may be as follows: 8, 14, 15, 16, 17, 18, 19, 50. The mean of these numbers is 19.625 . However, the extremes in this set (8 and 50) distort this value. The interquartile range is a method of measuring the spread of the middle 50% of the values and is useful since it ignore the extreme values.
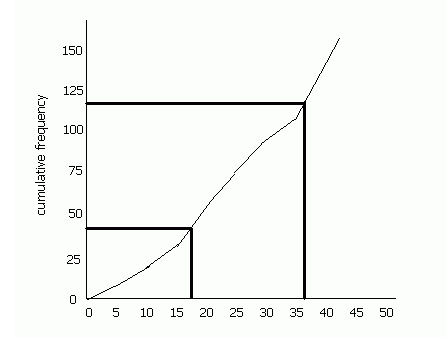
The lower quartile is (n+1)/4 th value (n is the cumulative frequency, i.e. 157 in this case) and the upper quartile is the 3(n+1)/4 the value. The difference between these two is the interquartile range (IQR).
In the above example, the upper quartile is the 118.5th value and the lower quartile is the 39.5th value. If we draw a cumulative frequency curve, we see that the lower quartile, therefore, is about 17 and the upper quartile is about 37. Therefore the IQR is 20 (bear in mind that this is a rough sketch- if you plot the values on graph paper you will get a more accurate value).

