Grouped and Ungrouped Data
This section explains types of data, including ungrouped and grouped data.
Types of Data
In order to work with data you must first know the differences between the types of data.
Quantitative data is data that has numerical values for example time and height. Questions about quantitative data could include: How Many? How Much and How Long?
Qualitative data is data that describes qualities or characteristics so cannot be measured or expressed using numbers for example eye colour.
Discrete data is qualitative and cannot have a value.
Continuous data is quantitative and has a value.
In some situations it’s worth noting whether the data is primary or secondary.
Ungrouped Data
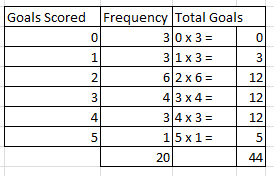
The table below shows the goals scored by a school hockey team over a season of 20 games.

To work out the mean we do the following calculation.
Total goals scored
How many games
= 44 ÷ 20 = 2.2 goals per game.
The median interval is the group with the middle value, so out of 20 games the half point is 10th and 11th value. Both of these are in the third group, so 2 goals scored.
The mode is the most observed data, the most common goals scored is also 2. This frequency occurred in 6 of the games.
Grouped Data
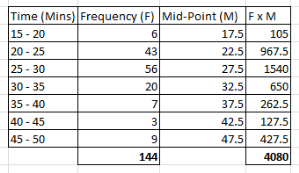
The table below shows the times taken by 144 runners at their local 5K parkrun.

The estimated mean =
Total time for all park runners = 4080 ÷ 144 = 28.33 minutes.
Number of park runners
This is only the estimated mean as it uses the mid-point for each group and not the actual values of the times for each runner.
The median interval is the 72nd runner who finished in group 3 – so the mean of the group is between 25 and 30 minutes.
The modal group is also 25 to 30 minutes as 56 runners finished in this group.
This video shows you how to calculate the mean, the median and the mode using grouped and ungrouped data sets.
For more information of working out averages click here.
