Two Way Tables
Creating two way tables is an excellent way to represent data with two different variables. Two way tables allow you to sort data to show two different categories quickly and easily.
The video below explains sampling methods and uses an example of how to work with two way tables.
An Example of a Two-Way Table
A café wants to see how popular its range of hot drinks is in its three different sizes: Small, Medium and Large. The Café sells Cappuccinos, Lattes and Hot Chocolates. They took a sample of their customer orders on a day. The completed two way table shows a breakdown of the drinks sold.
Image

From the above table we can see that there were a total of 33 drinks sold. Typical exam questions you will face may ask you to complete the table with certain variables missing.
You may be asked to work out the probability of a particular order, for example what would be the probability of a medium cappuccino being ordered?
To work this out simply take the number of medium cappuccinos and divide this by the total number of orders.
In this example 5 ÷ 33 = 0.15 (to 2 d.p).
Another Two-Way Table
Image
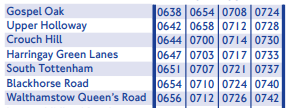
Look at the above train timetable. Olivia lives near Upper Holloway station her office is a 15 minute walk from South Tottenham station, she needs to be at work for 7.45am. What train does she need to catch?
Looking at the table we can see she needs to catch the 7.12 train (as she will need to be at South Tottenham station at 7.30 to get to work on time).